
Equal Loudness Contours
Equal loudness contours are also referred to as Fletcher and Munson curves. Loudness is difficult to measure because it is a subjective and psychological quantity.
In the 1930’s Fletcher and Munson pioneered the work in understanding how the human ear responds to loudness across the audible frequency range.
The lowest equal loudness contour represents the threshold of hearing with the highest being the threshold of pain.
Many test subjects sat subjective listening experiments and the results were averaged to form the basis of the equal loudness curves we refer to today.
Each separate curve is represented by a unit called the Phon.
Today ISO 226:2023 – Acoustics — Normal equal-loudness-level contours is the international standard used as a standardised base reference.
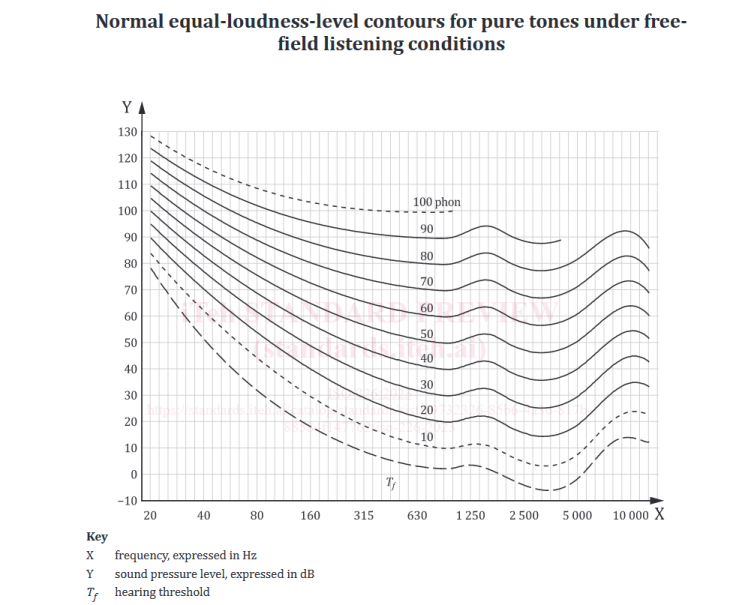
The curves are plotted for each 10dB rise in level with the reference tone being at 1kHz.
They all exhibit a ‘dip’ at 4kHz which reflects the sensitivity of the ear at this frequency range.
The curves indicate the level higher or lower tones must be raised to in order to create the same impression of average perceived loudness. As can be seen, lower frequency tones need to be raised substantially to be perceived by a listener as the same loudness level as say a tone at 4kHz.
The relationship between the decibel and the phon scale at 1kHz is the same. However, because the ear exhibits different sensitivity at different frequencies the Phon curves vary considerably with frequency.