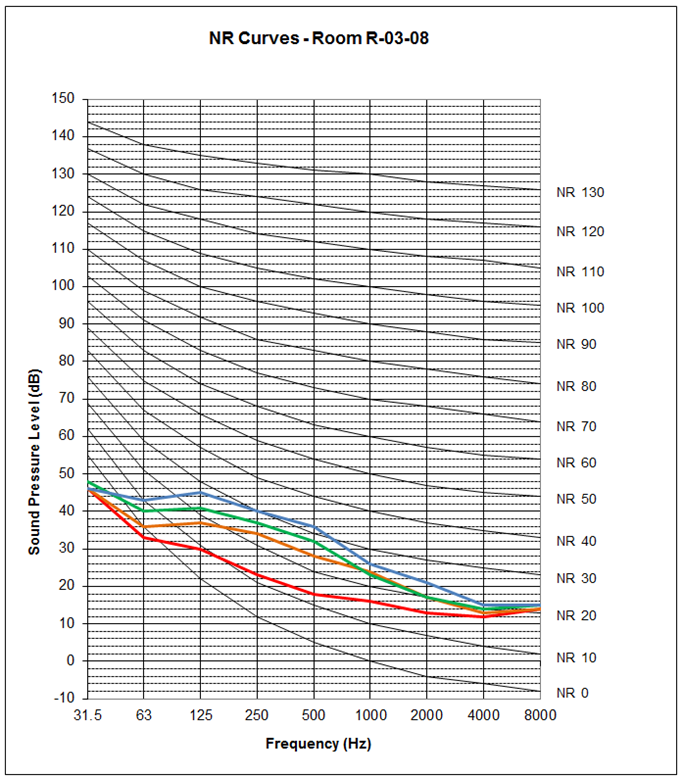
Noise Rating (NR) Curves
Noise Rating (NR) Curves are primarily the UK version of the NC (Noise Criteria) Curves used in the USA.
The only difference being the frequency values in each octave band differ slightly.
The curves are used to ‘rate’ a broadband noise level into a single figure whilst taking the frequency content into consideration.
An example is shown below. The coloured lines were measured octave band data from different services operating in a room.

The series of curves each have a defined value across the octave band frequency range. Each is named after its respective 1kHz value.
They are used to define noise limits at different frequencies, hence, allowing the character of the noise to be defined or controlled.
For example, a sound pressure level reading of LAeq 40dB may contain the majority of its sound energy in one particular octave band.
An NR level is determined by comparing the sound level in each octave band with the corresponding values in the NR table.
The NR curve number which applies to each frequency band is the highest numerical value which is not exceeded in that octave band.
The NR curve for the overall spectrum is the highest NR number of all the frequency bands.
| Noise Rating Curve (NR) | Application |
| NR25 | Broadcast and recording studios. |
| NR30 | Homes, hospitals, theaters, cinema, conference rooms. |
| NR35 | Libraries, museums, court rooms, schools, flats, hotels, executive offices. |
| NR40 | Halls, corridors, restaurants, offices, shops. |
| NR45 | General offices, department stores. |
| NR50 | Offices with typing and printers. |
| NR60 | Light engineering works. |
| NR70 | Heavy engineering works. |
